← Catalogue
Critical raw materials · 1st edition · July 2026
Rare earth metals market in Russia and the world
Resource base, mining, separation, metallurgy, magnets, foreign trade, prices, regulation and forecast to 2035
250pages
17chapters
154tables
98figures
2010–2025data period
Summary
A comprehensive desk study of the rare earth metals market covering the entire value chain — from exploration and mining to separated oxides, metals, alloys and permanent magnets. It analyses the global and Russian markets, assesses the resource potential of Russia and the EAEU, and provides scenario forecasts for the industry amid China's export restrictions and the restructuring of global supply chains.
Key findings
- The global market is not resource-constrained: reserves cover 200+ years; the constraints are technological, capital and institutional.
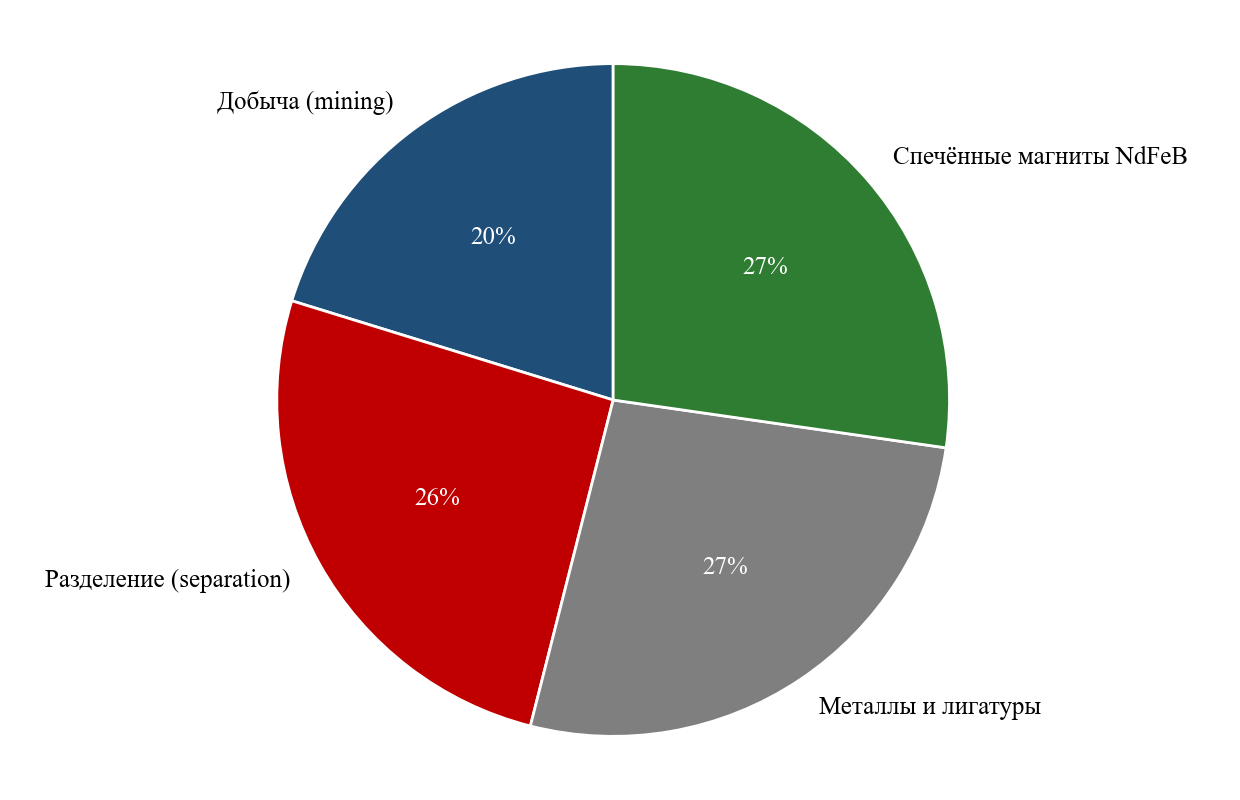
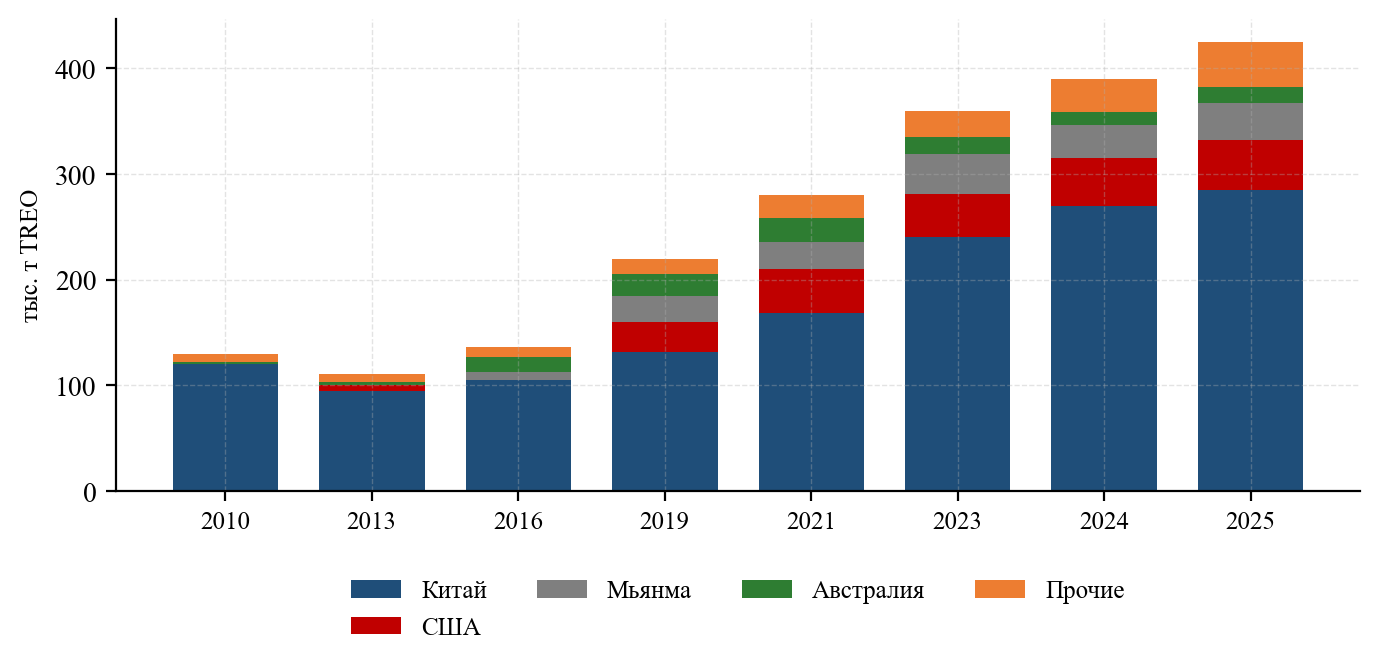
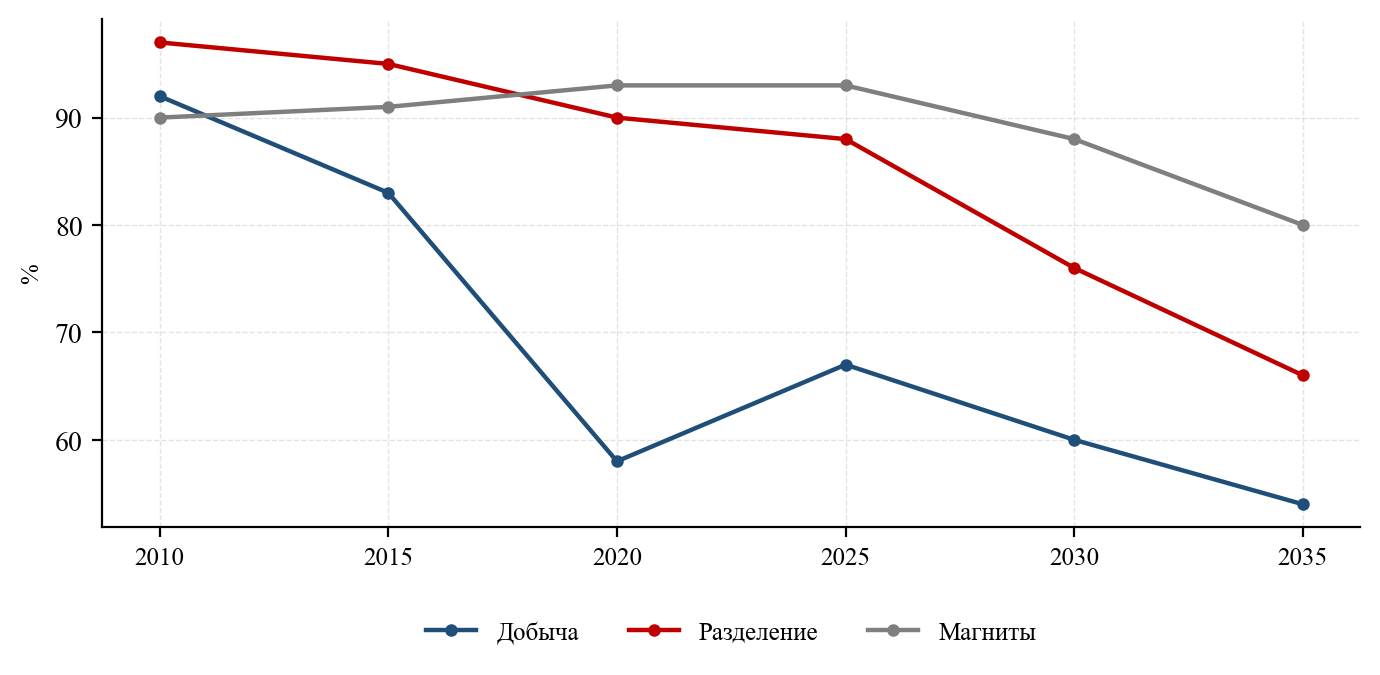
- Concentration rises along the value chain: China holds 67–69% of mining, 88% of separation, 91% of metallurgy and 93% of sintered-magnet output.
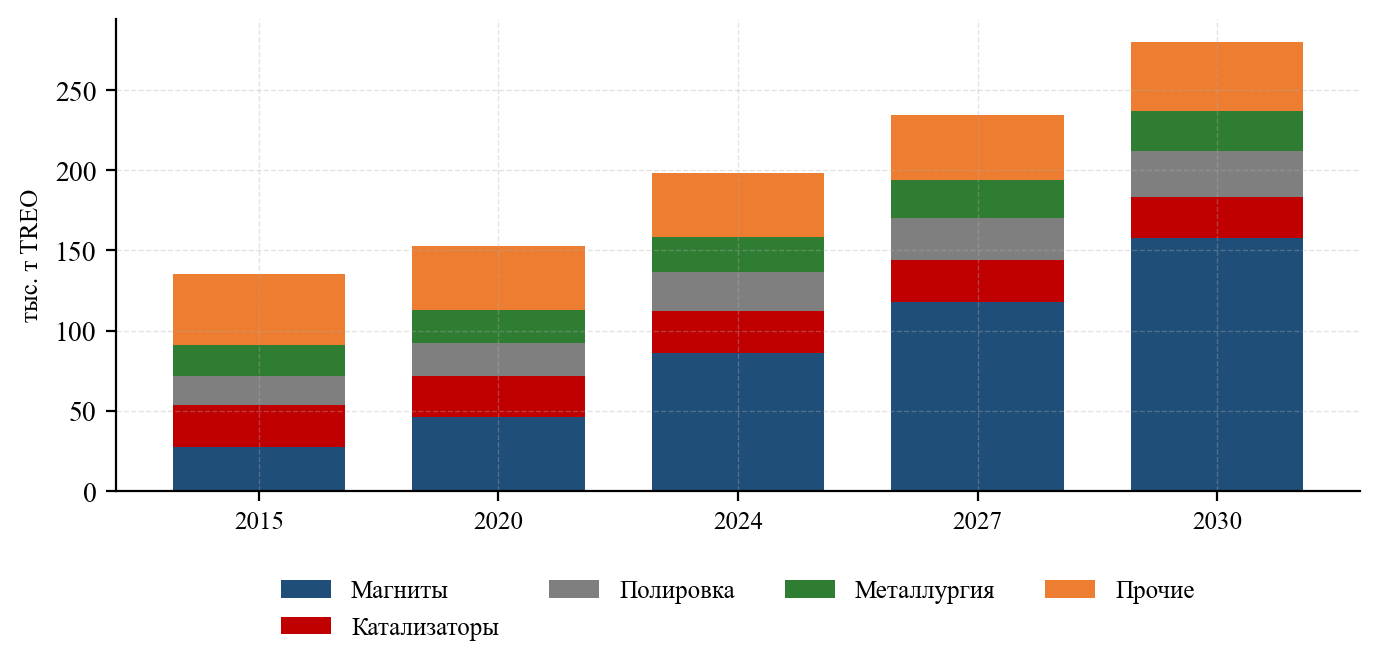
- About 90% of market value comes from four elements (Nd, Pr, Dy, Tb) with a physical share below 20% — the 'basket-balance problem'.
- Non-Chinese separation capacity runs at about 40%: the barrier is not capacity but cost, access to the right feedstock and sales of surplus elements.
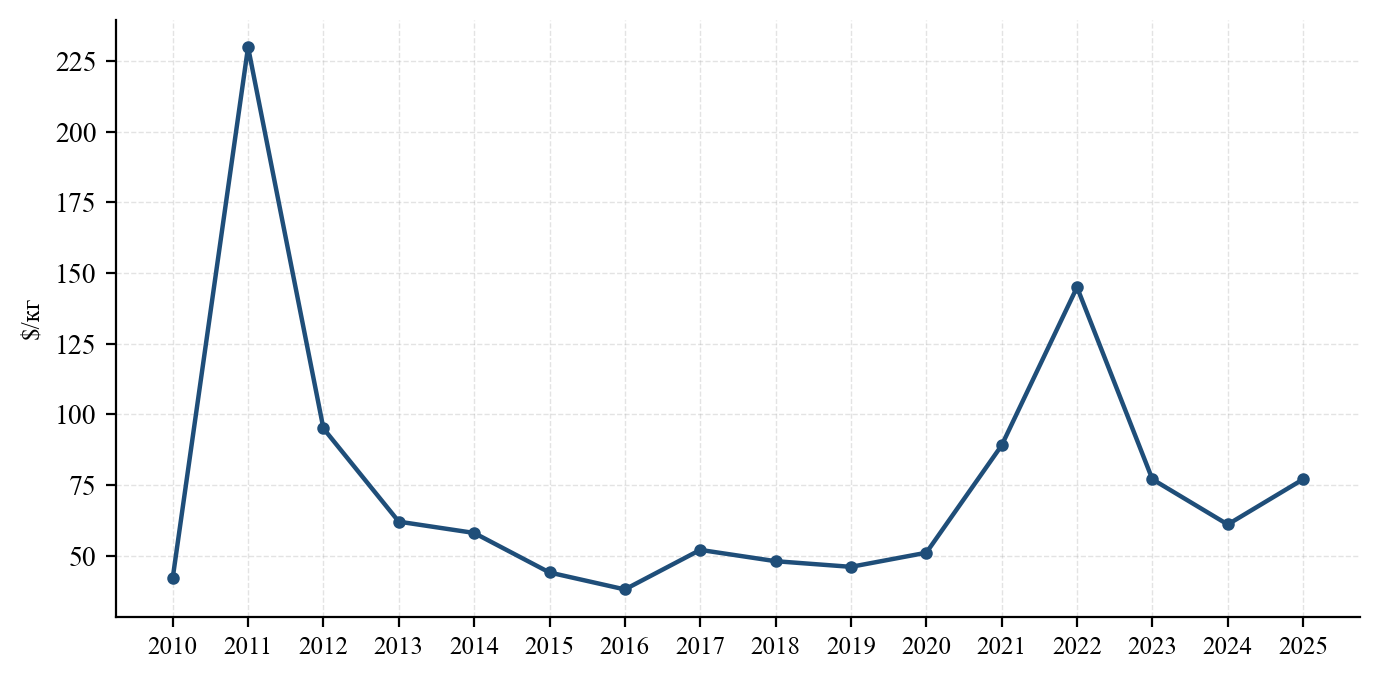
- The investment cycle (5–8 years) exceeds the length of price peaks (12–18 months), which blocks market-driven diversification without non-market price support.
- China's 2023–2025 export controls created a 3–14× gap between domestic and external prices and triggered a structural reshaping of the industry.
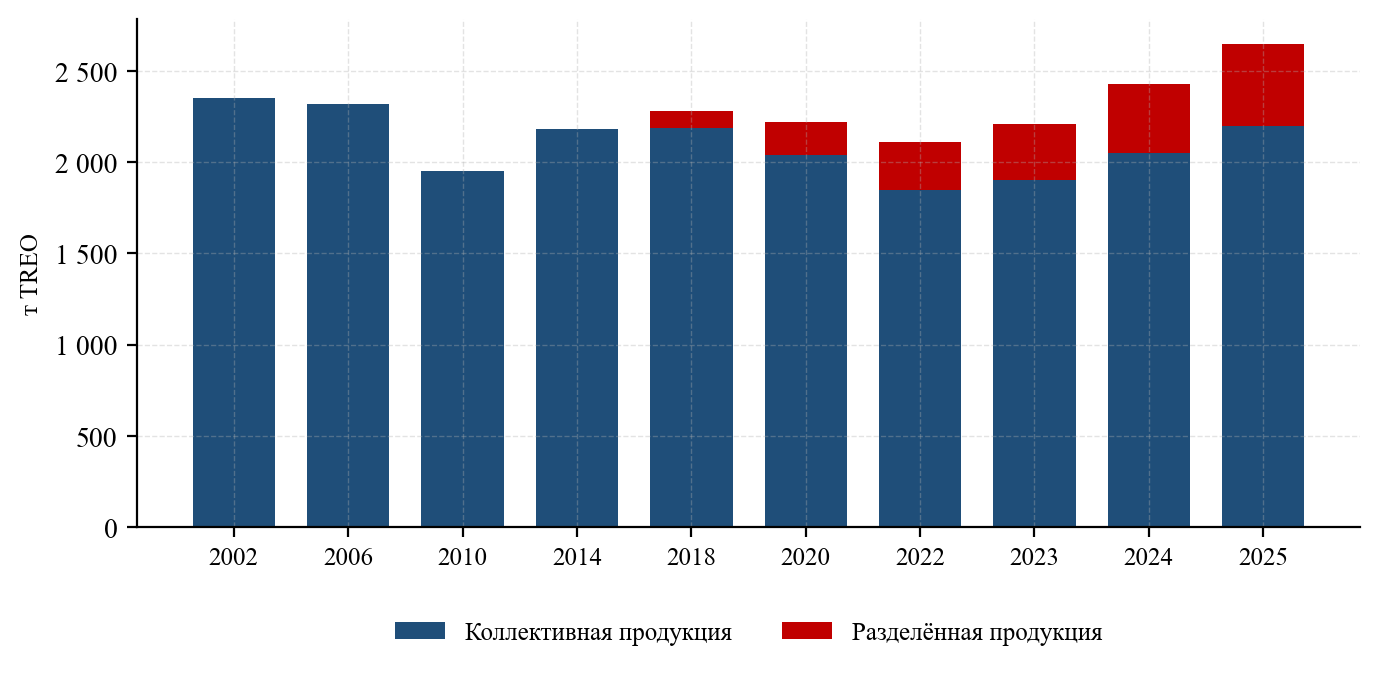
- 97% of Russia's balance reserves are in deposits where REEs are not recovered or not developed; the country's share of world output fell from 2.6% to 0.6%.
- Russia's technological gap is concentrated in the final stages: grain-boundary diffusion (TRL 3–4), heavy-group separation and magnet production (TRL 5–6).
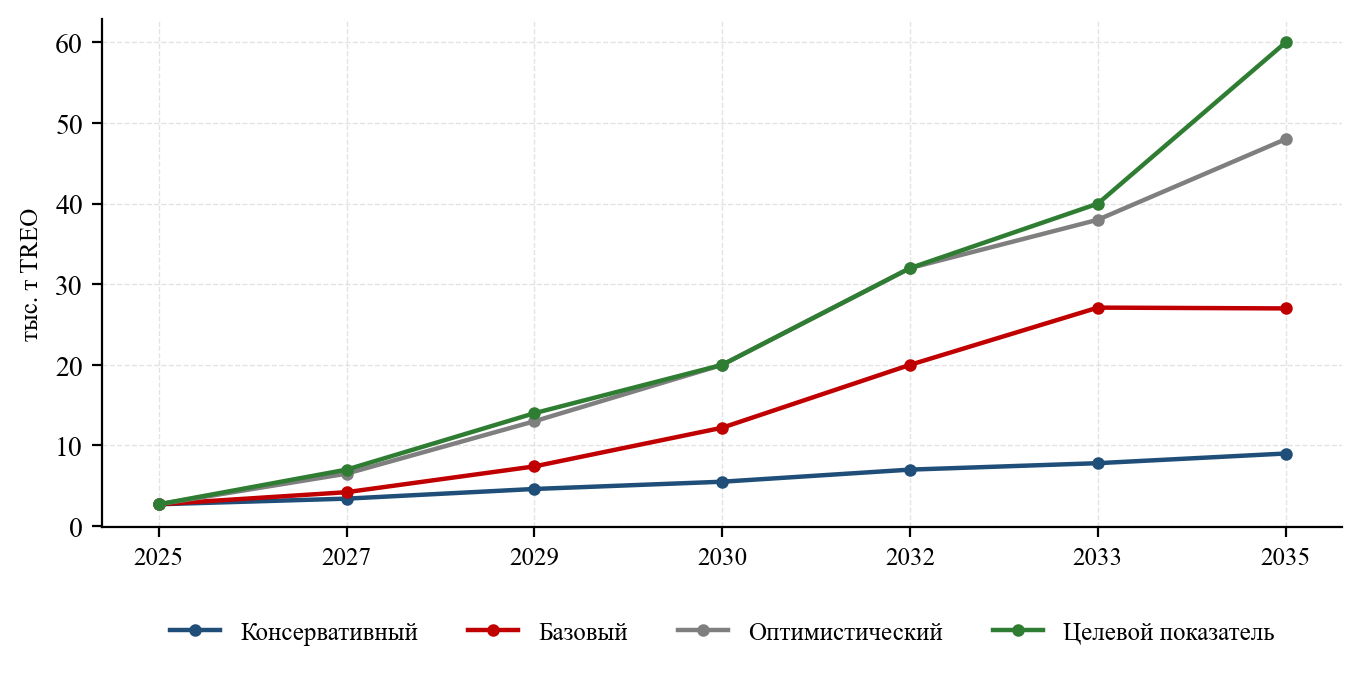
- The 20 kt TREO target is achievable around 2032 rather than 2030; the programme is 63% dependent on a single project — Tomtor.
- The priority is not raising raw-material volumes but closing the technology gap at the final stages: a full cycle at 5 kt beats a raw-material model at 20 kt.
Analysis excerpts
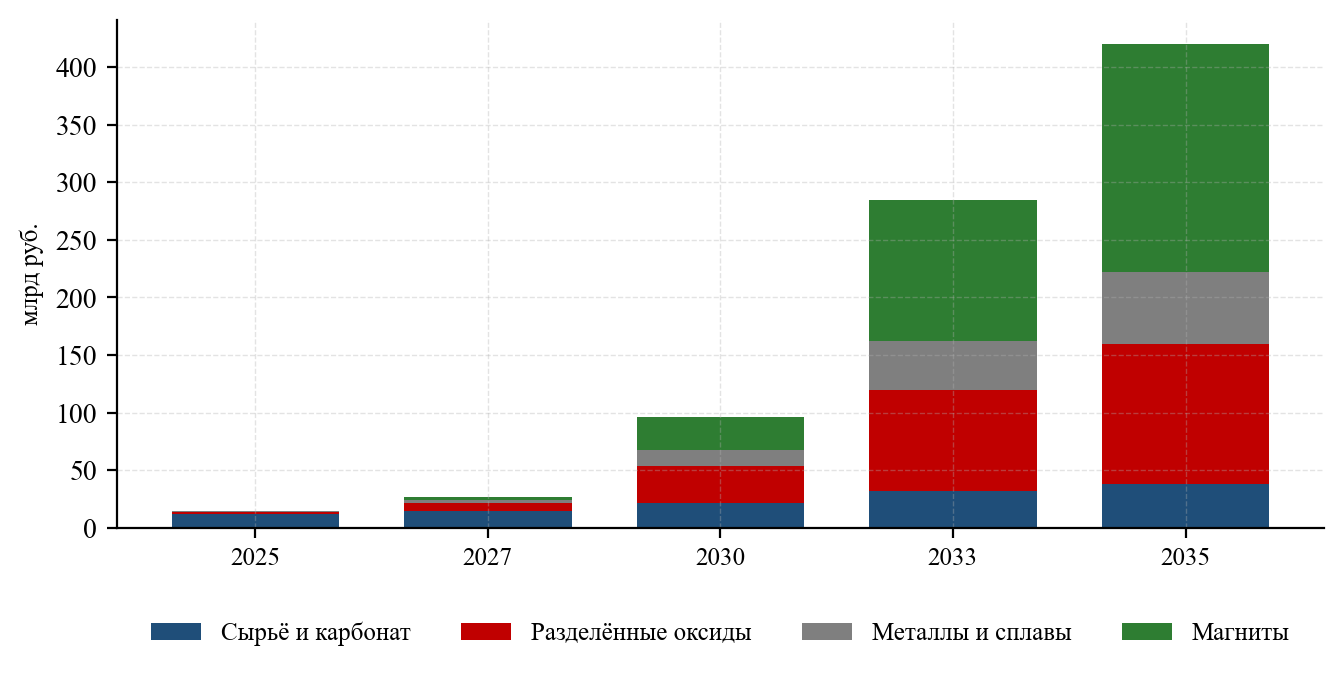
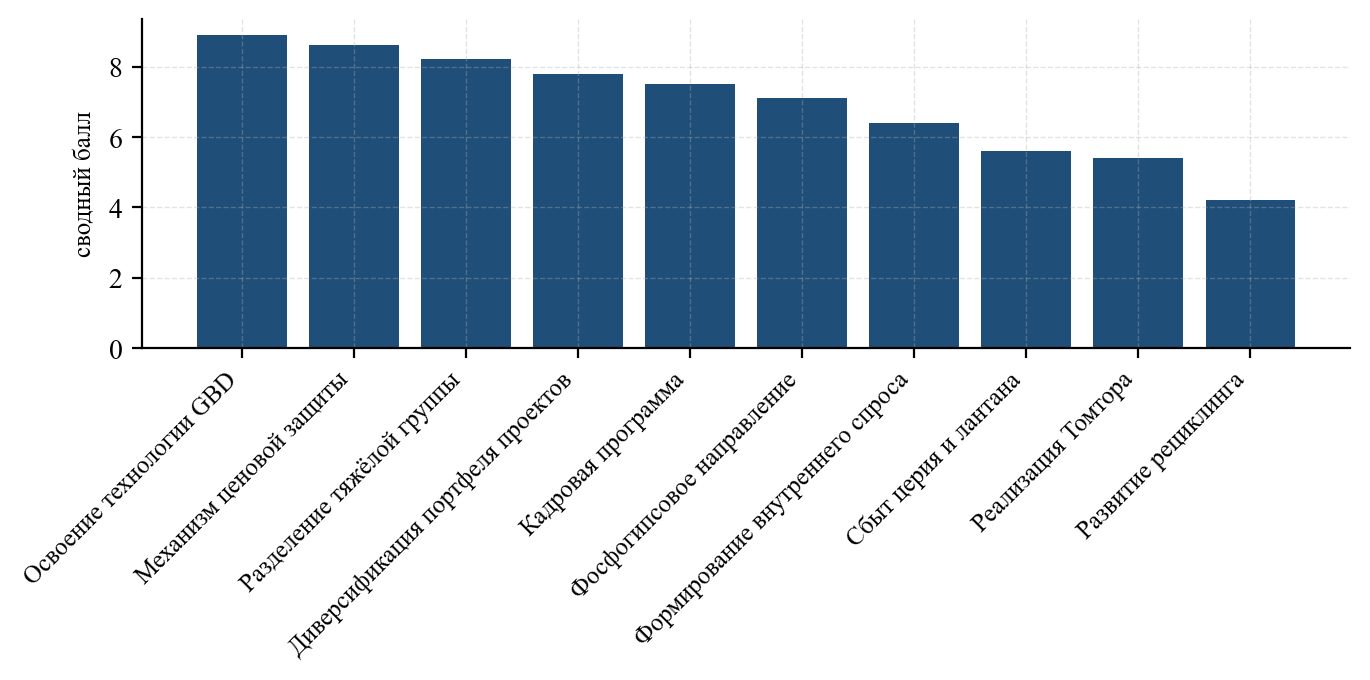
Selected charts from the report (98 in total).